
Customer Journey Mapping
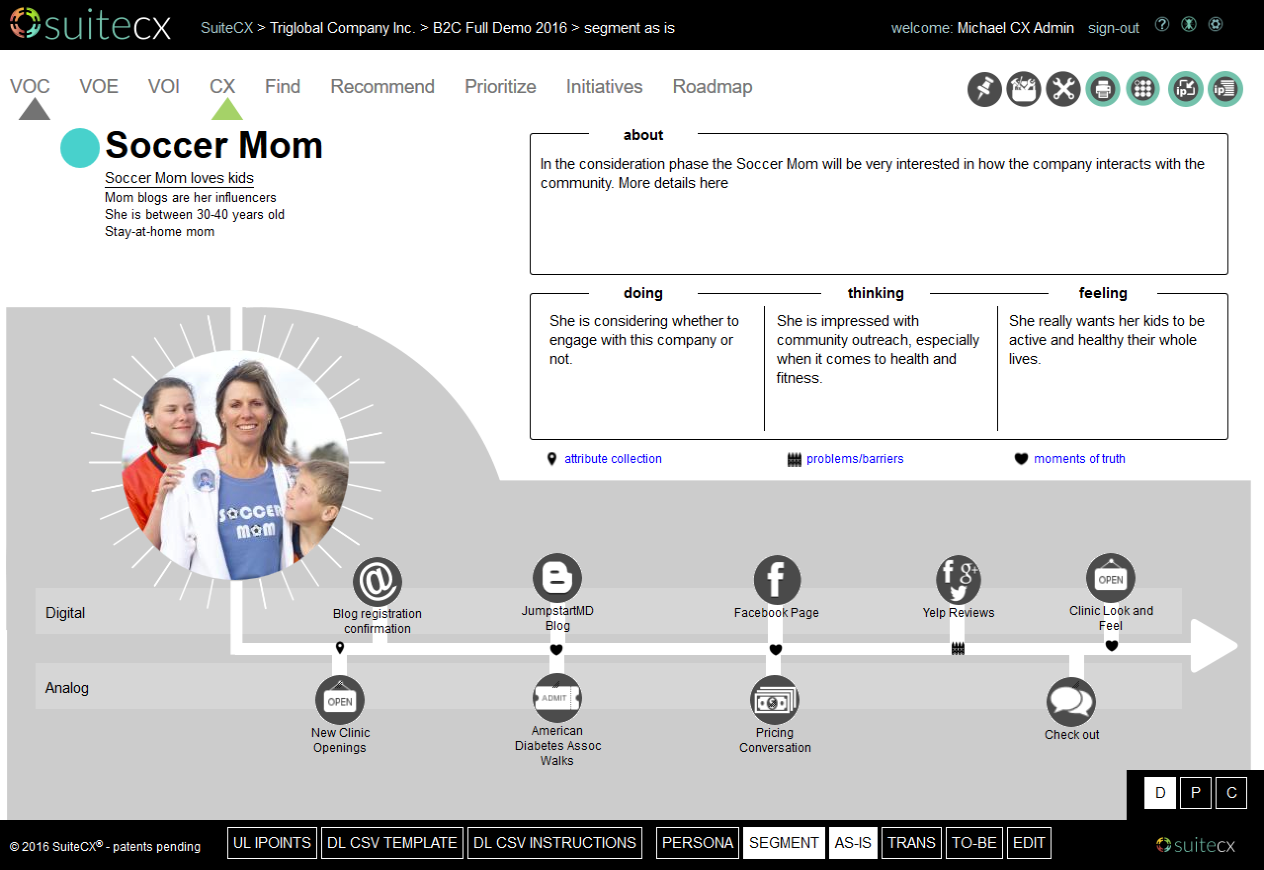
Personas/Segment maps enable you to gather metrics and descriptive information then present them aligned to the customer journey.
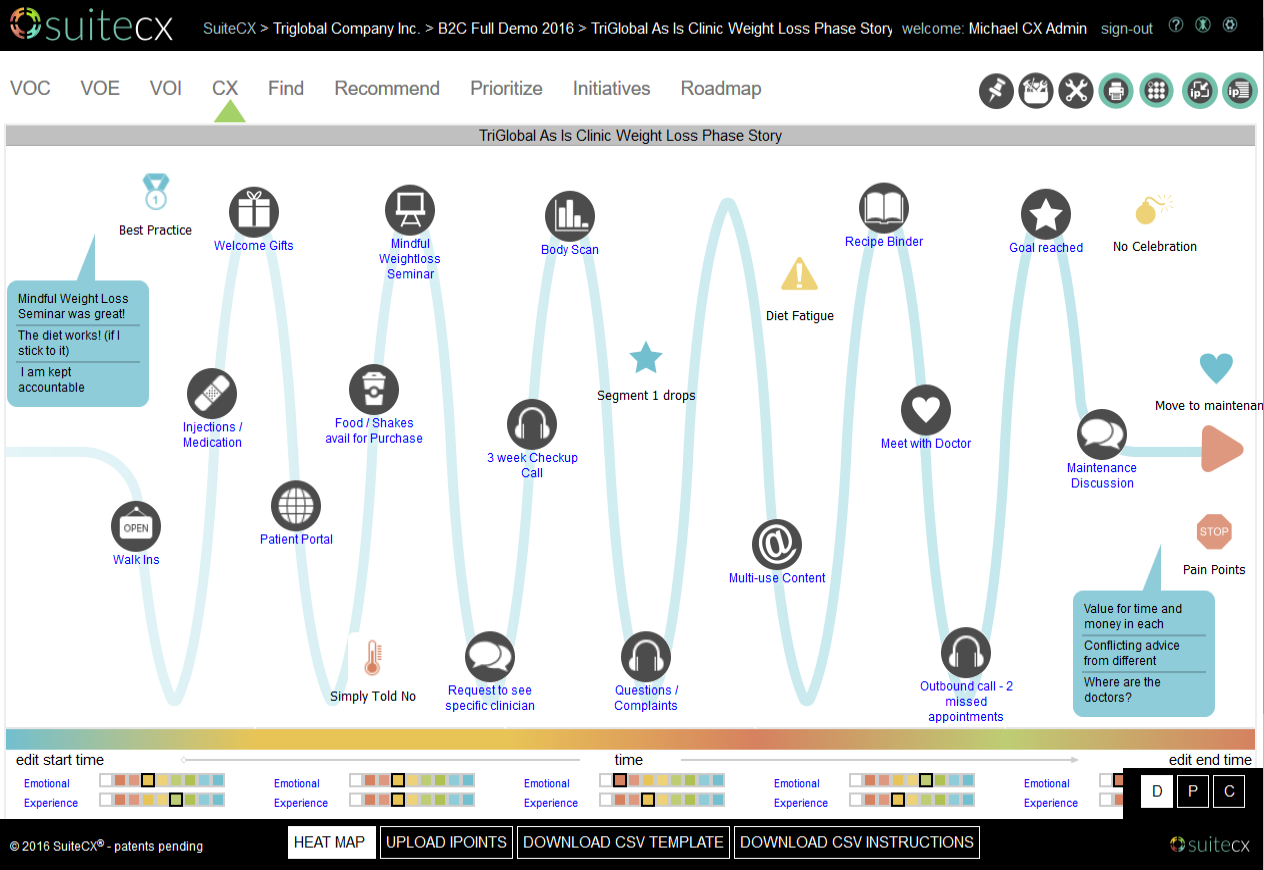
SuiteCX storytelling capabilities allow you to tell a compelling visual story about your customers’ experiences.
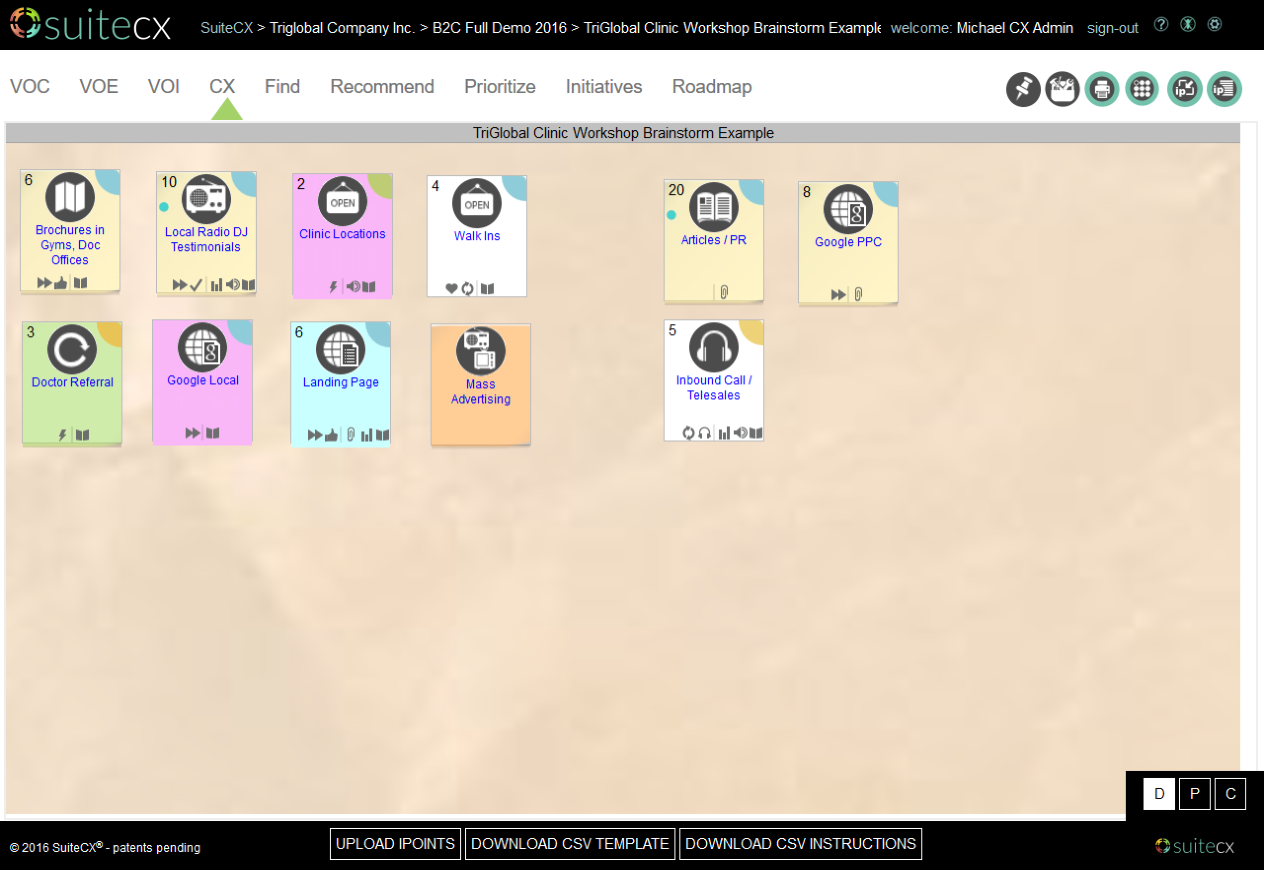
Brainstorming maps allow you to replicate the butcher paper and sticky note experience in digital format.
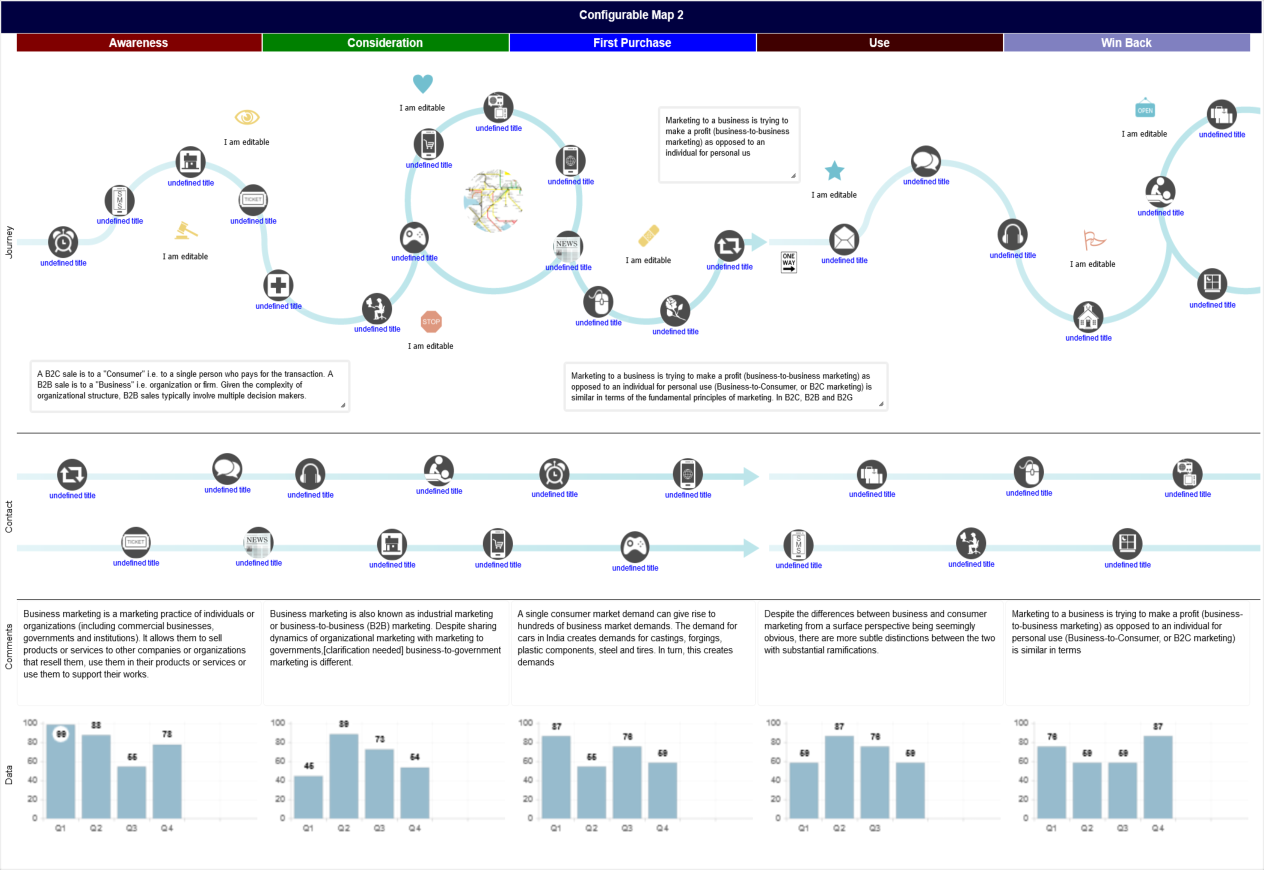
Infographics and fact based maps are easy to build and customize; start by stacking maps then add text and graphs, build a customer improvement plan.
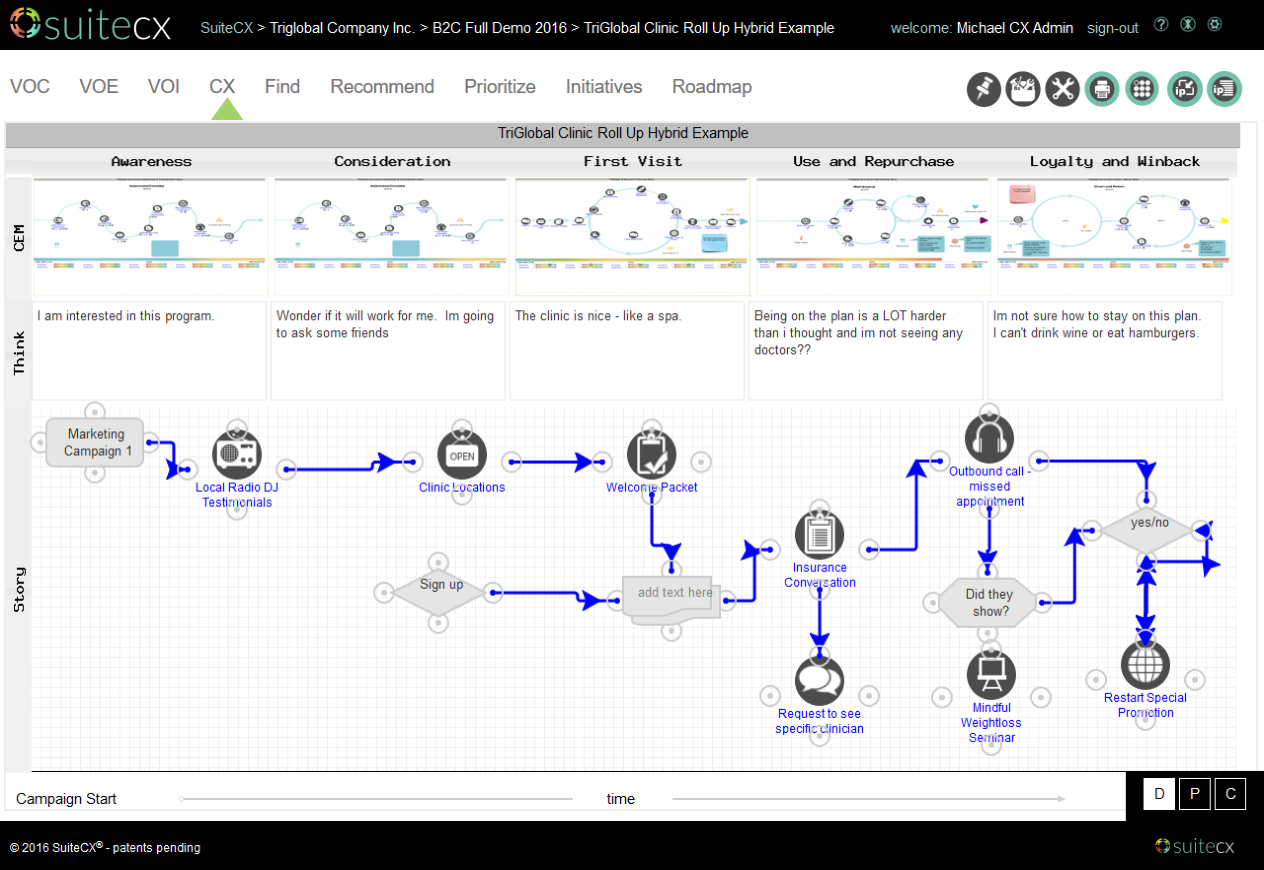
Present information over time and link IPoints to one another with arrows. Show a journey above and a process below.
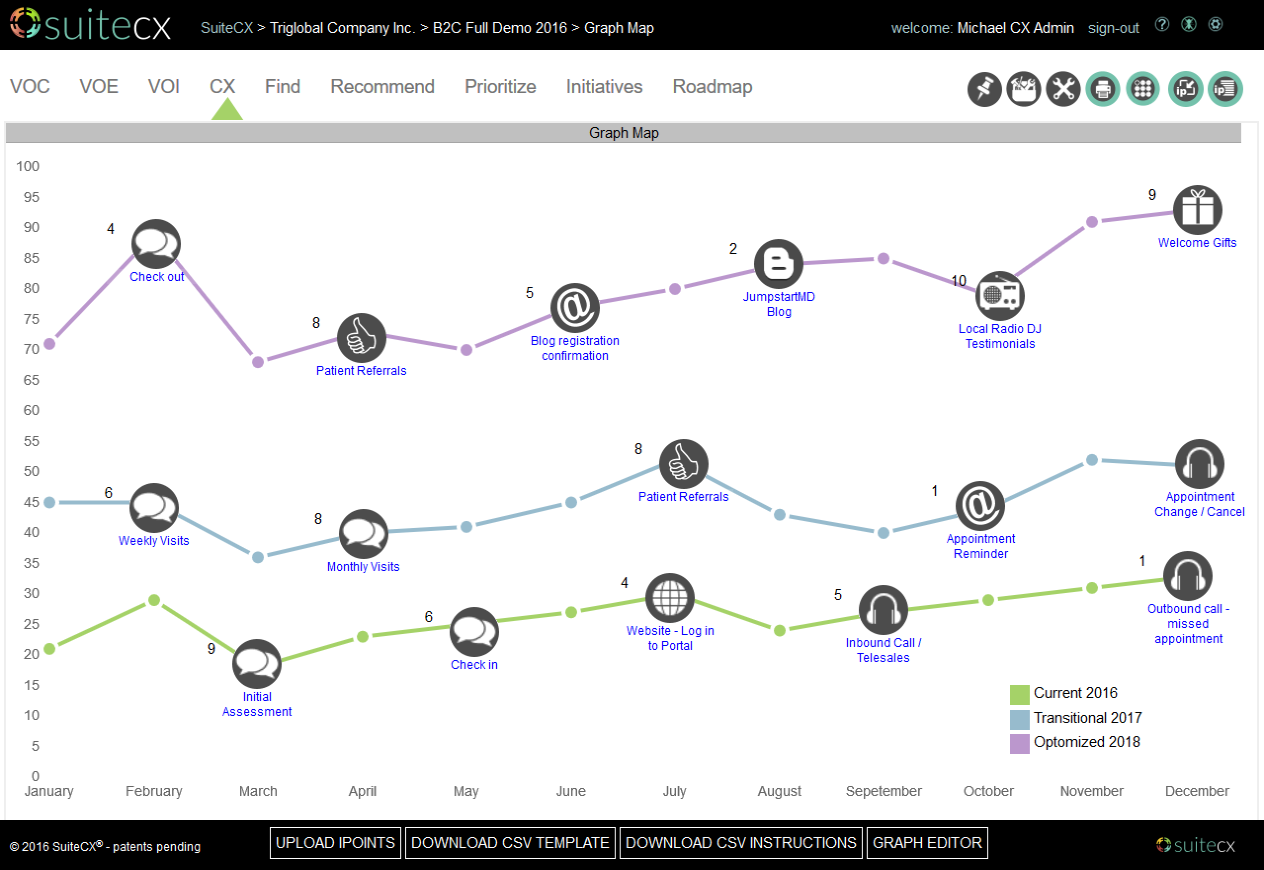
Graph story maps mix metrics and story elements to show up to 3 variations on change.
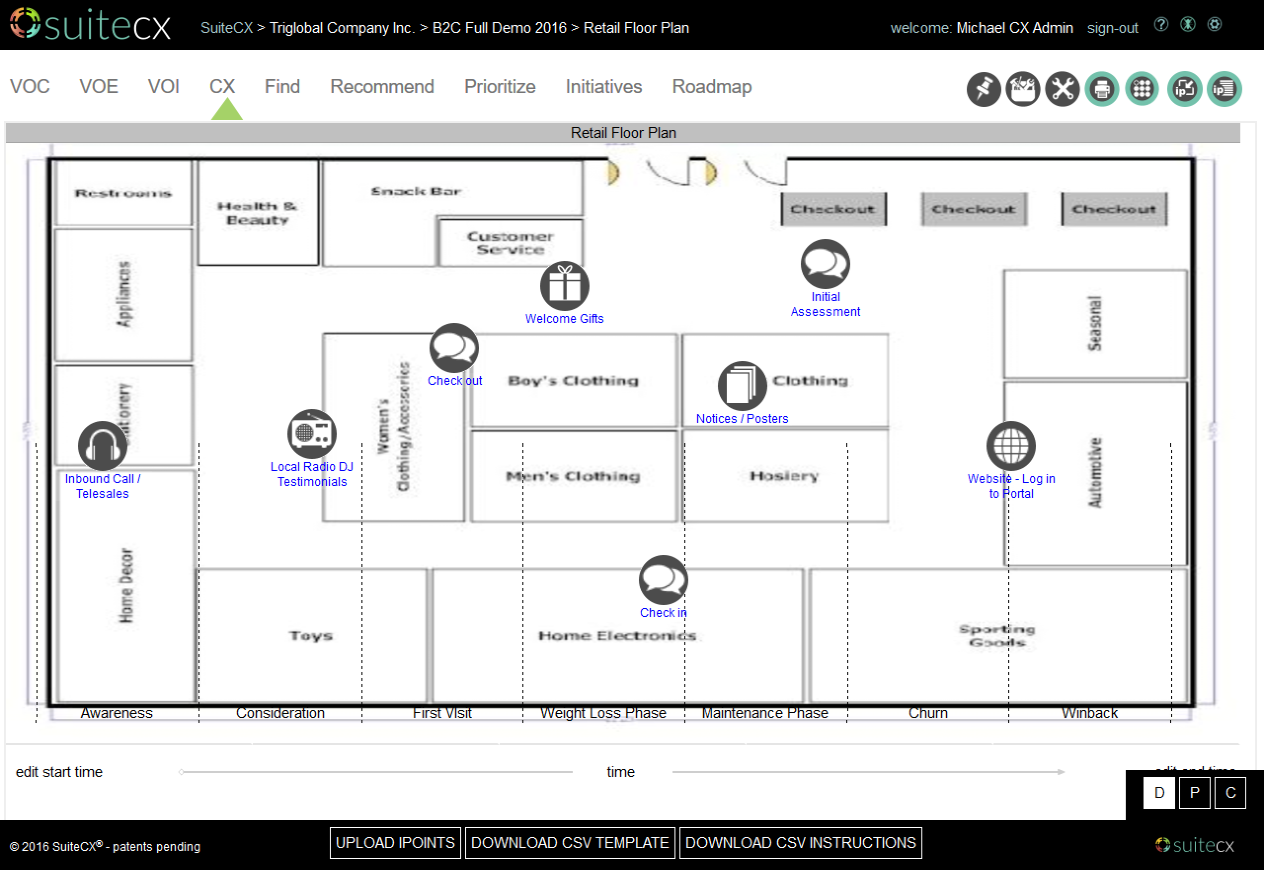
Upload your own customized map backgrounds to build the kind of map you want.
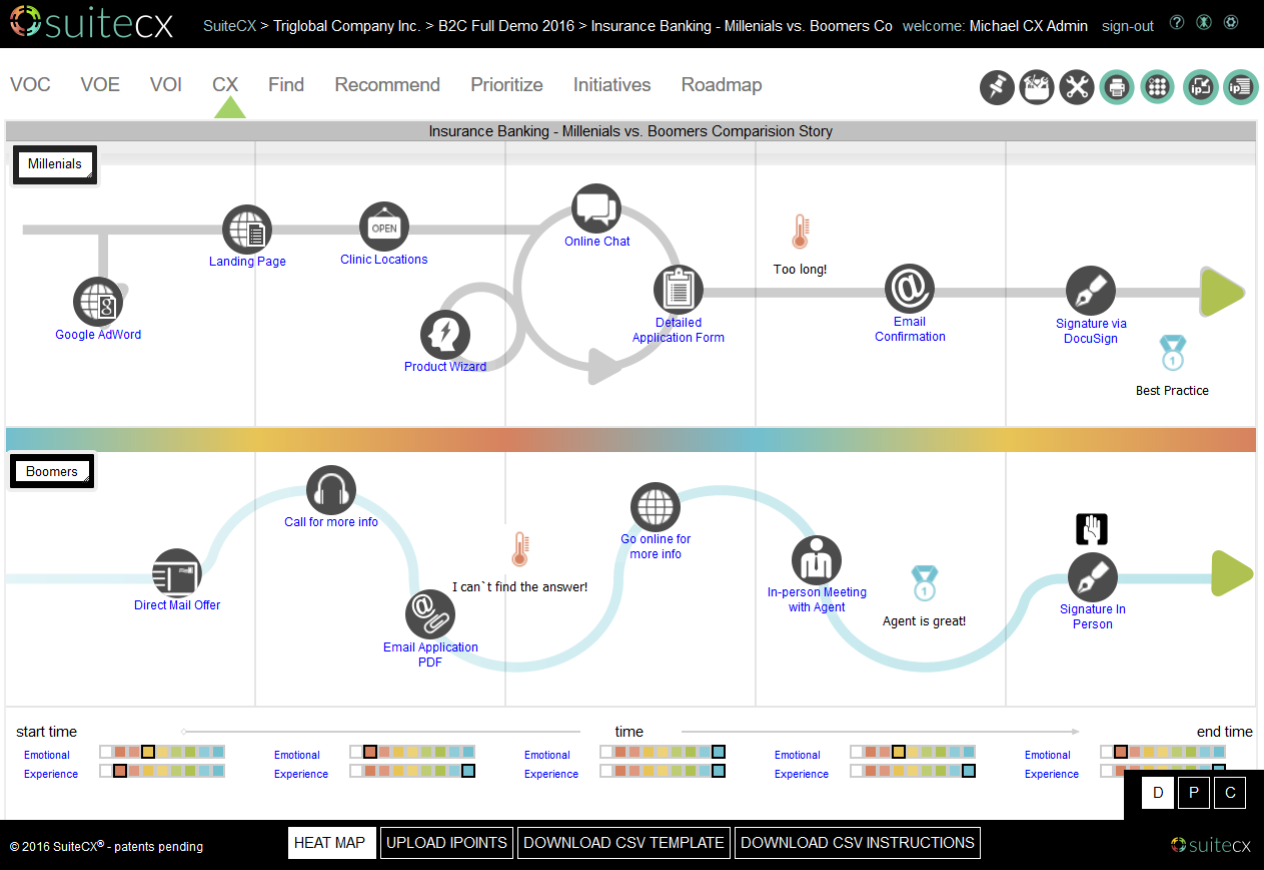
Illustrate powerful front-stage/back-stage interactions to reveal breakdowns in process and communication.
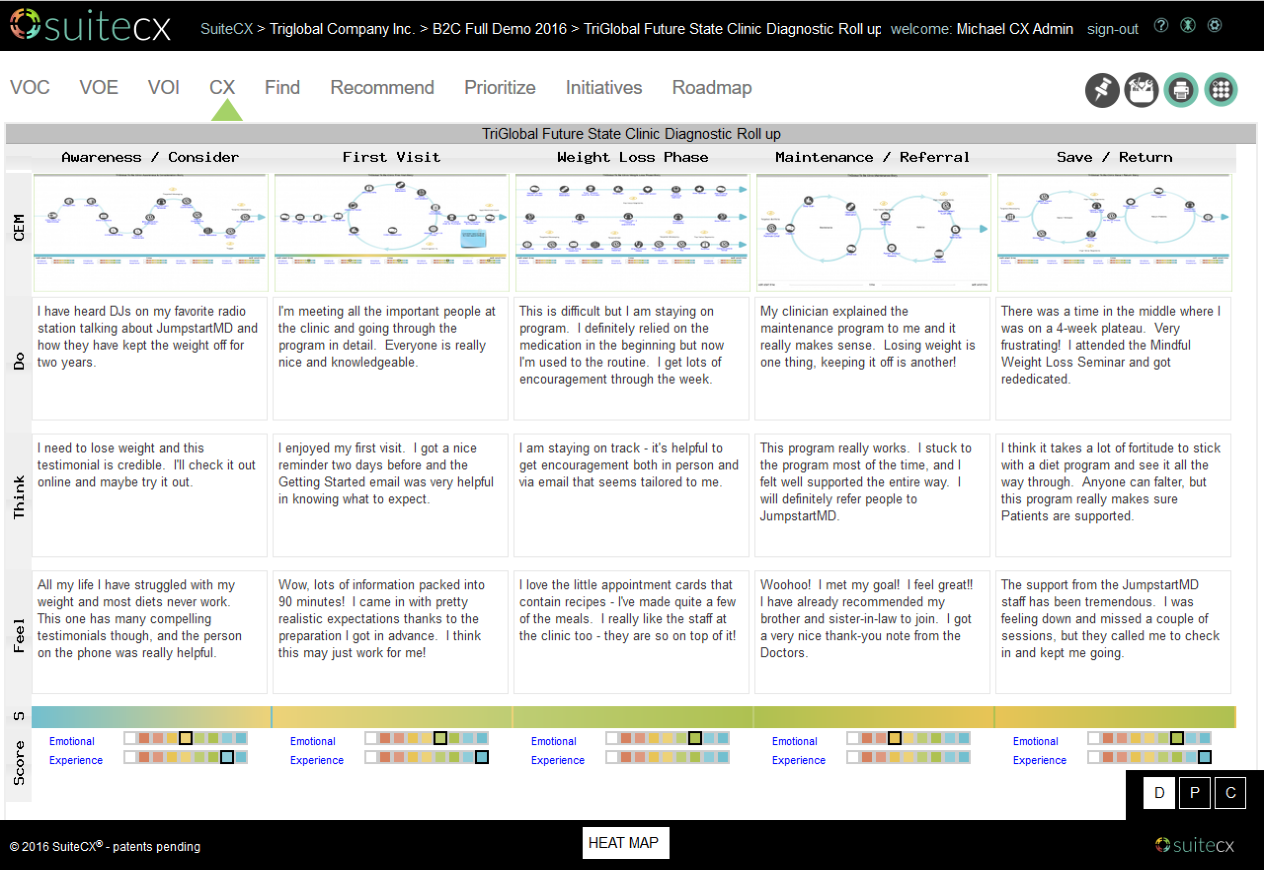
Roll your maps up into a comprehensive view to present an entire customer relationship and supporting data and processes in one place.
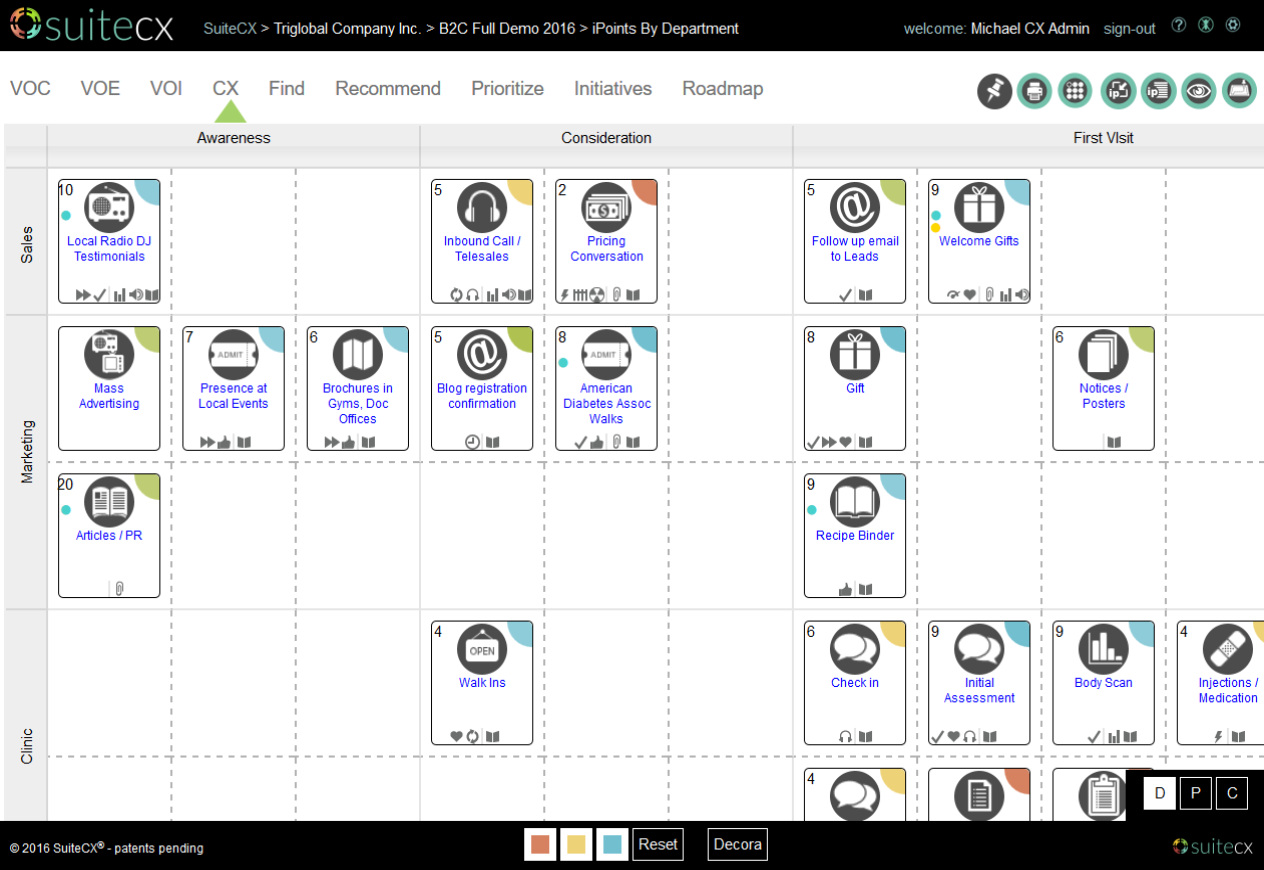
Build an inventory of IPoints (interactions) and give them lifecycle by department or channel context — create once and use many times.
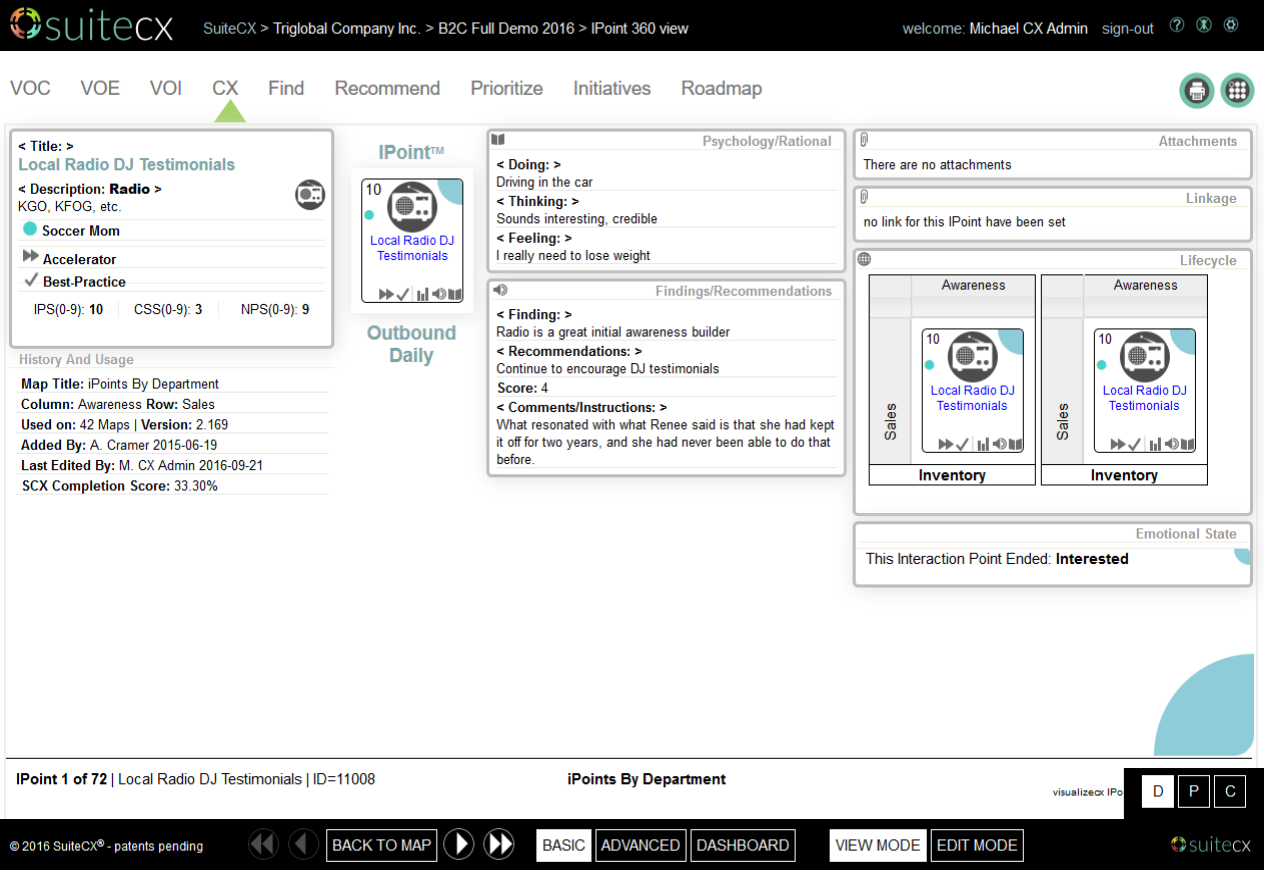
Open up an IPoint to the 360 view. IPoints are mini-databases, which contain all manner of data elements that pertain to the particular customer interaction.
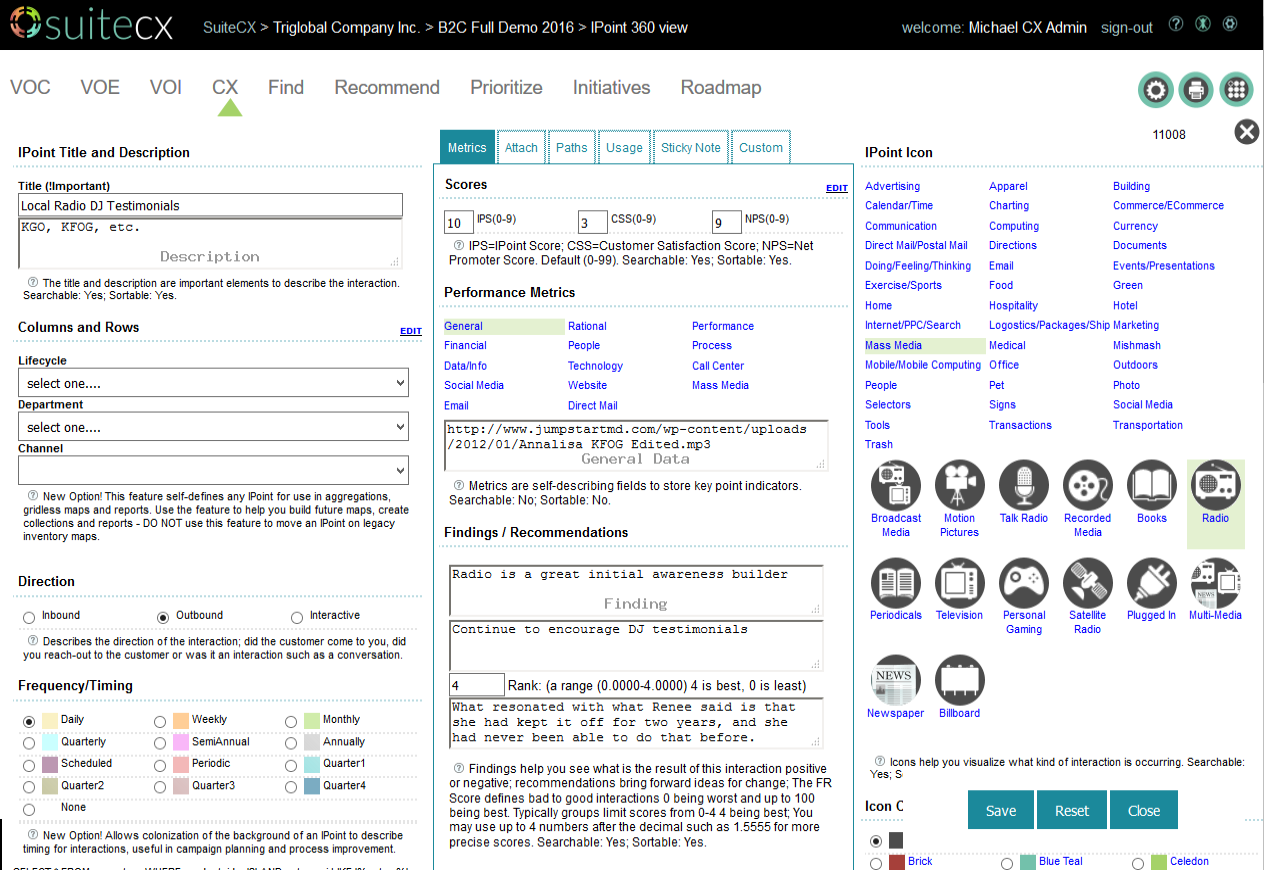
IPoints host 178 stock data fields that you can use to consolidate segment, campaign and NPS or Satisfaction scores.
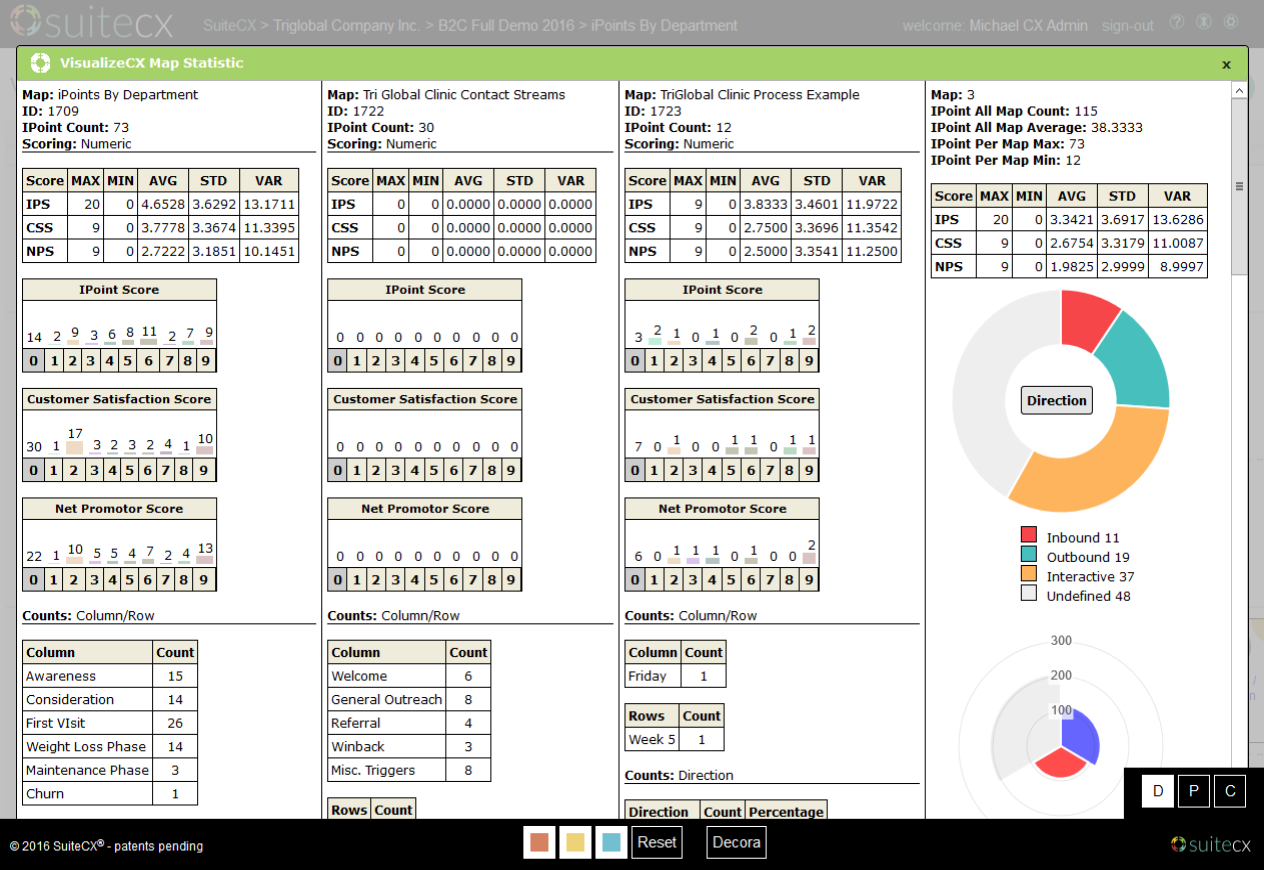
Compare IPoint statistics across maps and time.
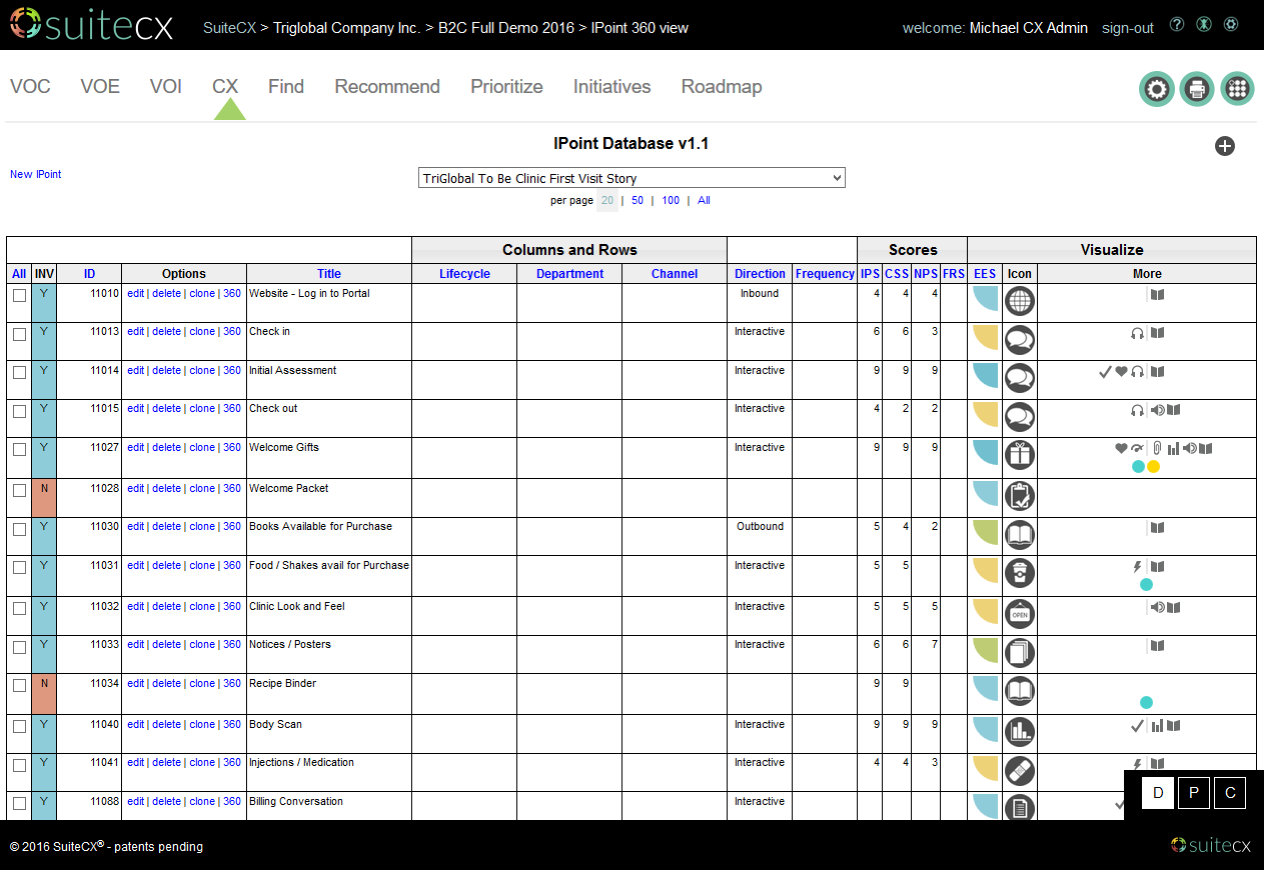
Manage a large number of IPoints in an intuitive powerful interface.
Customer Journey Mapping (CJM) and Infographics are powerful tools for envisioning, designing and visualizing a holistic experience from the customer’s point of view. CJMs and infographics enable the team and its executives to gain a clear understand of the future experience in intuitive pictures. It enables teams to collaborate on a central vision and put themselves into the minds of customers. It helps them to see every interaction for its own (inclusive of channels, data and even emotions) as well as see the interactions in concert.
Traditionally, creating CJMs was a manual process, subject to endless “node complexity” where the cross tabulation of channels, interactions, segments, etc., created a tedious, unconnected cataloging effort. The design conventions were often reinvented every time.
SuiteCX changes this by providing an array of CJM visualization templates and tools with all interaction and segment information kept in a centralized database, coordinating and streamlining the efforts of large and diverse CX teams however and wherever they choose work.
SuiteCX enables users to capture and visualize a wide combination of emotional, functional and data-driven customer information. It allows you to use words, iconography and images to create the base map. There are over 20 different mapping visualizations available, allowing you to find just the right visualization for your customers experience.
Once you have the base map you can easily and quickly attach collateral and data to tell your customers’ stories, from high-level overviews of customer lifecycle stages to granular inspections of processes and interactions. You can compare current state and to be states, processes or data flows that drive the experience taking the maps from brainstorm to UX or solutions design level in one place.
Our unique IPoints act as data collectors to allow you to note moments of truth, pain points, barriers as well as emotional states. They have the ability to hold and display measures as well as other performance data and ethnographic information.
SuiteCX goes further, though, in creating great, compelling Customer Journey Maps. The maps are alive with customer data, including sources from surveys (e.g., Voice of the Customer, Voice of the Employee, Voice of the Institution), interaction metrics (e.g., NPS, CSAT), big data analytics, segmentation data, clickstream data, and even operational data to measure how the actual experiences are performing over time. It takes the CJM to an entirely new level of power, usefulness and value.
Some of the features include:
- Create an outside-in and comprehensive end to end map of all the touchpoints that a customer has with your business
- Use the tool to capture work in real time in workshops
- Attach information to the individual touchpoints
- Create new versions of maps for different customer groups
- Manage, amend and update the map
- Include visuals in other documents (e.g., PowerPoint)
- Print out high quality visuals quickly and easily
- Track and measure the impact of changes over time
Once in place these maps become the inputs and basis for prioritizing customer experience improvements and the cornerstone for changes in people, process, marketing technology, and customer focused operational delivery.